Note
Go to the end to download the full example code.
Midp#
author: OpenTPS team
This example shows how to create a mid-position CT from a 4DCT and visualize it.
running time: ~ 6 minutes
Setting up the environment in google collab#
import sys
if "google.colab" in sys.modules:
    from IPython import get_ipython
    get_ipython().system('git clone https://gitlab.com/openmcsquare/opentps.git')
    get_ipython().system('pip install ./opentps')

    import opentps
imports
import numpy as np
import matplotlib.pyplot as plt
import time
import logging
import math
import os
import the needed opentps.core packages
from opentps.core.data.dynamicData._dynamic3DModel import Dynamic3DModel
from opentps.core.data.dynamicData._dynamic3DSequence import Dynamic3DSequence
from opentps.core.data.images import CTImage
from opentps.core.data.images import ROIMask

logger = logging.getLogger(__name__)
Output path#
output_path = os.path.join(os.getcwd(), 'Output', 'ExampleMidP')
if not os.path.exists(output_path):
        os.makedirs(output_path)
logger.info('Files will be stored in {}'.format(output_path))
Synthetic 4DCT generation function#
def getPhasesPositions(numberOfPhases, minValue, maxValue):

    angleList = np.linspace(0, 2 * math.pi, numberOfPhases + 1)[:-1]
    cosList = np.cos(angleList)

    diff = maxValue - minValue

    posList = minValue + diff / 2 + cosList * diff / 2

    return posList.astype(np.uint8)

def createSynthetic3DCT(diaphragmPos = 20, targetPos = [50, 100, 35], spacing=[1, 1, 2], returnTumorMask = False):
    # GENERATE SYNTHETIC CT IMAGE
    # background
    im = np.full((170, 170, 100), -1000)
    im[20:150, 70:130, :] = 0
    # left lung
    im[30:70, 80:120, diaphragmPos:] = -800
    # right lung
    im[100:140, 80:120, diaphragmPos:] = -800
    # target
    im[targetPos[0]-5:targetPos[0]+5, targetPos[1]-5:targetPos[1]+5, targetPos[2]-5:targetPos[2]+5] = 0
    # vertebral column
    im[80:90, 95:105, :] = 800
    # rib
    im[22:26, 90:110, 46:50] = 800
    # couch
    im[:, 130:135, :] = 100
    ct = CTImage(imageArray=im, name='fixed', origin=[0, 0, 0], spacing=spacing)

    if returnTumorMask:
        mask = np.full((170, 170, 100), 0)
        mask[targetPos[0]-5:targetPos[0]+5, targetPos[1]-5:targetPos[1]+5, targetPos[2]-5:targetPos[2]+5] = 1
        roi = ROIMask(imageArray=mask, origin=[0, 0, 0], spacing=spacing)

        return ct, roi

    else:
        return ct


def createSynthetic4DCT(numberOfPhases=4, spacing=[1, 1, 2], returnTumorMasks=False, motionNoise=True):

    # GENERATE SYNTHETIC 4D INPUT SEQUENCE
    CT4D = Dynamic3DSequence()

    ## For the diaphragm position
    diaphMotionAmp = 12
    diaphMinPos = 20
    diaphPosList = getPhasesPositions(numberOfPhases, diaphMinPos, diaphMinPos+diaphMotionAmp)

    if motionNoise:
        diaphNoise = [[3, 1],
                  [6, -1],
                  [9, -1],
                  [12, 1],
                  [15, 1]]
    else:
        diaphNoise = [[3, 0],
                      [6, 0],
                      [9, 0],
                      [12, 0],
                      [15, 0]]

    for elemIdx in range(len(diaphNoise)):
        if diaphNoise[elemIdx][0] <= numberOfPhases - 1:
            diaphPosList[diaphNoise[elemIdx][0]] += diaphNoise[elemIdx][1]

    ## For the target z position
    zMotionAmp = int(np.round(diaphMotionAmp * 0.8))
    zMinPos = 40
    zPosList = getPhasesPositions(numberOfPhases, zMinPos, zMinPos+zMotionAmp)

    if motionNoise:
        zNoise = [[3, 1],
                  [6, -1],
                  [9, -1],
                  [12, 1],
                  [15, 1]]
    else:
        zNoise = [[3, 0],
                      [6, 0],
                      [9, 0],
                      [12, 0],
                      [15, 0]]

    for elemIdx in range(len(zNoise)):
        if zNoise[elemIdx][0] <= numberOfPhases - 1:
            zPosList[zNoise[elemIdx][0]] += zNoise[elemIdx][1]

    ## For the target x position
    xMotionAmp = 6
    xMinPos = 42
    xPosList = getPhasesPositions(numberOfPhases, xMinPos, xMinPos+xMotionAmp)

    if motionNoise:
        xNoise = [[3, 1],
                  [6, -1],
                  [9, -1],
                  [12, 1],
                  [15, 1]]
    else:
        xNoise = [[3, 0],
                  [6, 0],
                  [9, 0],
                  [12, 0],
                  [15, 0]]

    for elemIdx in range(len(xNoise)):
        if xNoise[elemIdx][0] <= numberOfPhases-1:
            xPosList[xNoise[elemIdx][0]] += xNoise[elemIdx][1]

    xPosList = np.roll(xPosList, 2)
    # print('xPosList', xPosList)

    phaseList = []
    if returnTumorMasks:
        maskList = []
        for phaseIndex in range(numberOfPhases):
            phase,  mask = createSynthetic3DCT(targetPos=[xPosList[phaseIndex], 95, zPosList[phaseIndex]], diaphragmPos=diaphPosList[phaseIndex], spacing=spacing, returnTumorMask=returnTumorMasks)
            phaseList.append(phase)
            maskList.append(mask)

    else:
        for phaseIndex in range(numberOfPhases):
            phase = createSynthetic3DCT(targetPos=[xPosList[phaseIndex], 95, zPosList[phaseIndex]], diaphragmPos=diaphPosList[phaseIndex], spacing=spacing)
            phaseList.append(phase)

    CT4D.dyn3DImageList = phaseList
    if returnTumorMasks:
        return CT4D, maskList
    else:
        return CT4D
Generate synthetic 4DCT And MidP#
# GENERATE SYNTHETIC 4D INPUT SEQUENCE
CT4D = createSynthetic4DCT()

# GENERATE MIDP
Model4D = Dynamic3DModel()
startTime = time.time()
Model4D.computeMidPositionImage(CT4D, 0, tryGPU=True)
stopTime = time.time()
print('midP computed in ', np.round(stopTime - startTime, 2), 'seconds')

# GENERATE ADDITIONAL PHASES
im1 = Model4D.generate3DImage(0.5/4, amplitude=1, tryGPU=False)
im2 = Model4D.generate3DImage(2/4, amplitude=2.0, tryGPU=False)
im3 = Model4D.generate3DImage(2/4, amplitude=0.5, tryGPU=False)
Dynamic 3D Sequence Created with  0 images
midP computed in  15.81 seconds
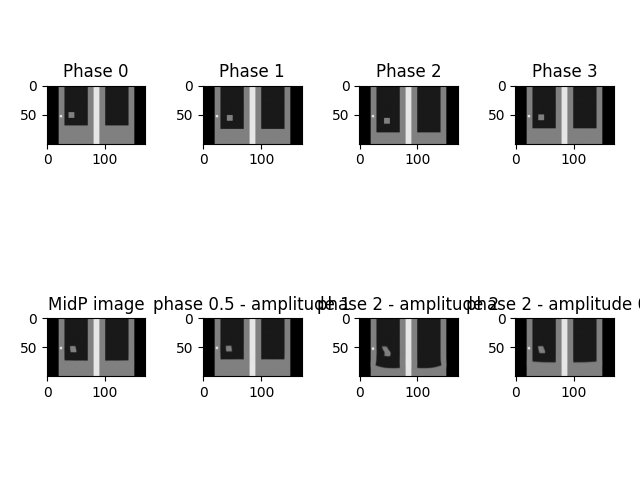
Display results#
fig, ax = plt.subplots(2, 4)
fig.tight_layout()
y_slice = 95
ax[0,0].imshow(CT4D.dyn3DImageList[0].imageArray[:, y_slice, :].T[::-1, ::1], cmap='gray', origin='upper', vmin=-1000, vmax=1000)
ax[0,0].title.set_text('Phase 0')
ax[0,1].imshow(CT4D.dyn3DImageList[1].imageArray[:, y_slice, :].T[::-1, ::1], cmap='gray', origin='upper', vmin=-1000, vmax=1000)
ax[0,1].title.set_text('Phase 1')
ax[0,2].imshow(CT4D.dyn3DImageList[2].imageArray[:, y_slice, :].T[::-1, ::1], cmap='gray', origin='upper', vmin=-1000, vmax=1000)
ax[0,2].title.set_text('Phase 2')
ax[0,3].imshow(CT4D.dyn3DImageList[3].imageArray[:, y_slice, :].T[::-1, ::1], cmap='gray', origin='upper', vmin=-1000, vmax=1000)
ax[0,3].title.set_text('Phase 3')
ax[1,0].imshow(Model4D.midp.imageArray[:, y_slice, :].T[::-1, ::1], cmap='gray', origin='upper', vmin=-1000, vmax=1000)
ax[1,0].title.set_text('MidP image')
ax[1,1].imshow(im1.imageArray[:, y_slice, :].T[::-1, ::1], cmap='gray', origin='upper', vmin=-1000, vmax=1000)
ax[1,1].title.set_text('phase 0.5 - amplitude 1')
ax[1,2].imshow(im2.imageArray[:, y_slice, :].T[::-1, ::1], cmap='gray', origin='upper', vmin=-1000, vmax=1000)
ax[1,2].title.set_text('phase 2 - amplitude 2')
ax[1,3].imshow(im3.imageArray[:, y_slice, :].T[::-1, ::1], cmap='gray', origin='upper', vmin=-1000, vmax=1000)
ax[1,3].title.set_text('phase 2 - amplitude 0.5')

plt.savefig(os.path.join(output_path, 'ExampleMidp.png'))
print('MidP example completed')
plt.show()
MidP example completed
Total running time of the script: (0 minutes 17.530 seconds)