Note
Go to the end to download the full example code.
Template Example#
This is a minimal example showing how to contribute to the Community Gallery. It just generates some random data and plots it.
Setting up the environment in google collab#
import sys
if "google.colab" in sys.modules:
    from IPython import get_ipython
    get_ipython().system('git clone https://gitlab.com/openmcsquare/opentps.git')
    get_ipython().system('pip install ./opentps')

    import opentps
imports
import numpy as np
import matplotlib.pyplot as plt
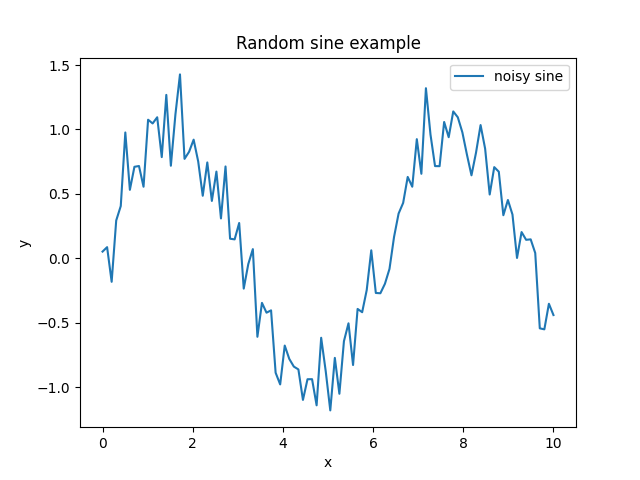
Step 1. Generate random data#
x = np.linspace(0, 10, 100)
y = np.sin(x) + 0.2 * np.random.randn(100)
Step 2. Plot the results#
To display your plot in the Sphinx gallery, make sure plt.show() is the last line of your code cell.
plt.figure()
plt.plot(x, y, label="noisy sine")
plt.legend()
plt.title("Random sine example")
plt.xlabel("x")
plt.ylabel("y")
plt.show()
Total running time of the script: (0 minutes 0.056 seconds)